For 0.11.0
Previous: Reports and Analyses

Circular Visualization
PHAT provides customizable circular vizualization of reference sequences through the PHAT genome builder. Click “GENOME BUILDER” on the toolbar to open it.

Creating and Opening Circular Figures
By default, no figure is open in the editor. Click the “Figures” drop down to see a list of reference files and their figures available to open. Clicking “New Figure” underneath a reference file name will create and open a new figure for that reference file. By default, a figure’s name is “New Figure”. Below each reference file name is the name of each figure created from it. Click on a figure’s name to open it.
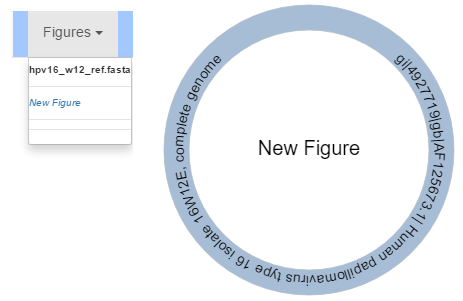
Brand New Figure
Creating a new figure will generate a visualization of just what is inside of its reference file. Contigs contained within the reference file will be assigned random colours and scaled according to the total size in nucleotides of the reference.
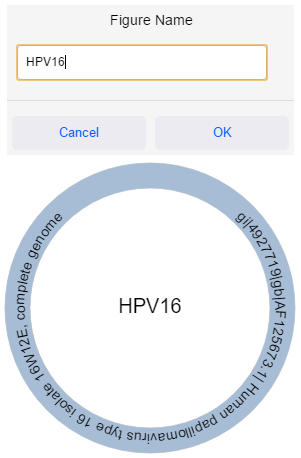
By default, a figure’s name is “New Figure”. Hover over the name of the figure in its centre and click on it to rename it. The figure name can also be changed by clicking “Figure Options”, “Edit Figure Name”.
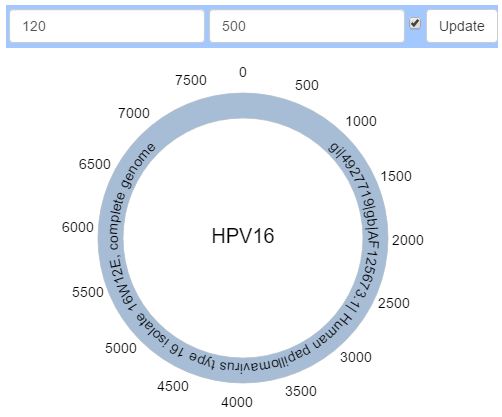
By default, a figure’s radius is 120. To grow or shrink a figure, edit the radius in the top bar and then click “Update” or press “Enter” to apply the changes to the figure.
By default a track interval of 500 is used but not shown. Click on the checkbox next to “Update” to show or hide the interval. Edit the interval distance in the top bar and click “Update” or press “Enter” to apply the changes to the figure.
Working With Contigs
Reference Contigs
Those contigs which are present in the reference file will be visualized and scaled accordingly. These are known as “Reference Contigs”, referring to the fact that they are read from the reference file itself. You cannot change their start/end positions or vertical adjustment relative to the figure.
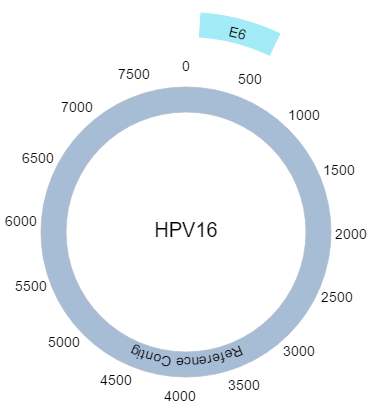
Custom Contigs
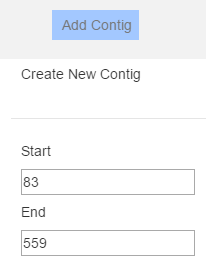
Unfortunately most reference files fail to annotate their sequences with the genes/chromosomes/other features we know exist. PHAT visualizes what is present in the reference file, while also enabling the user to add custom features. In order to add new features, click “Add Contig” in the top bar and enter a start and end position to define where in the reference sequence this contig should be. After clicking “Save Changes”, a contig called “New Contig” with a random colour will be rendered at the genomic range specified, and scaled accordingly.
Editing Contigs
Reference contigs are limited in what properties are editable. You can change their fill colour, text colour and name. You cannot delete them nor change any other properties.
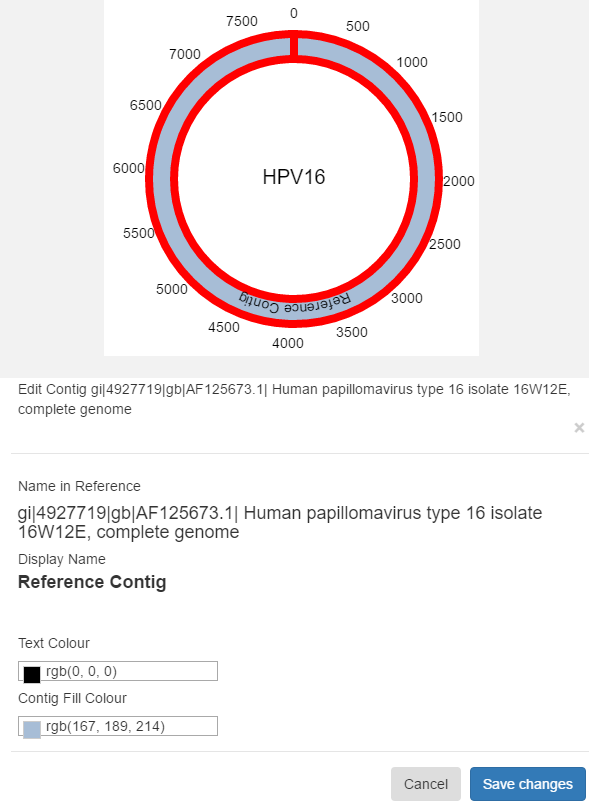
Custom contigs are free to edit as you see fit. You can change their fill colour, text colour, name, vertical adjustment, start and end positions as well as delete them.
Hover over the contig you want to edit until it becomes highlighted, then left click. Click “Save Changes” in the resulting dialog box to save your changes to the contig. Click “Cancel”, or click away to cancel. Contigs can also be edited by clicking “Figure Options”, “Edit Contigs” to see the full list of contigs in the figure. Click on the name of a contig to edit it.
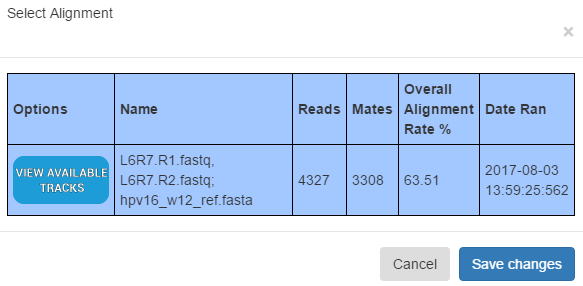
Working With Data Tracks
PHAT allows “tracks” of data generated from alignments to be applied to figures, on a per contig basis. Click on “Data Visualization” to view the alignments ran against the reference file. Click the “View Available Tracks” column in a given alignment to view data track options for it.
Creating Tracks
PHAT allows visualization of alignment coverage and SNP positions as data tracks. By default, no tracks are available. Select a colour for the data track and then click “Generate Coverage Track” or “Generate SNP Track” beside the contig you want to generate a track for. This may take some time depending on the size of the read files and reference file involved. When the track generation is complete, it will be listed under the appropriate section at the top of the “Track Options” dialog, in the colour that it will be displayed in. Currently, you cannot change the colour of a data track after it has been generated.
Scaling Coverage Tracks
By default, tracks are scaled by 1, that is, whatever depth is present in the alignment is used in the visualization. For alignments with extremely high coverage which are not visible, scaling tracks by a smaller number will shrink the visualization. Scaling by numbers larger than 1 will expand the visualization. The scaling factor used to generate a track cannot be changed after the track is generated.

Viewing Tracks
You can edit what tracks are displayed on a per alignment basis. Those tracks whose names are bolded will appear on the figure, those which are not bolded will not. You can toggle tracks on and off by clicking on their names. Click “Save Changes” to apply the changes.
Exporting Figures
Click on “Figure Actions” on the top bar, then “Export to SVG” to save the current figure as an SVG. This may take some time depending on the complexity of the figure.
Copying Figures
Creating contigs, annotating figures and generating data tracks can be a time consuming process. It is recommended to create contigs and annotate a figure once and then copy it many times to use as a base to build other figures from. Click “Figure Actions”, then “Create Copy of Figure” to copy a figure. Any data tracks generated for the figure will be copied as well. This may take some time depending on the complexity of the figure. Any changes to the original figure made after copying it will not be reflected in the copies.
Deleting Figures
To delete a figure, click “Figure Actions” on the top bar, then “Delete Figure”. This cannot be undone.
Large Figures
PHAT deals with “large figures” (references with millions of BP or 50 or more contigs) differently than other figures. By default, when creating a “large figure”, it will not be interactive and the names of its contigs will not be displayed. These options can be toggled through the “Figure Options” menu. Note: Changing these default settings for “large figures” may freeze or crash PHAT or cause the figure to be unopenable in the future. These settings can be toggled on and off for all figures.
Resizing Figures With Data Tracks
When resizing figures with data tracks, PHAT must recalculate the layout of all points on the track relative to the new size of the figure. This is not instantaneous. It can take some time depending on the size of the tracks.
Performance
At the time of writing, the genome builder tends to become slow when displaying hundreds of thousands of points of sparse coverage. That is, coverage with little or no sections of identical depth. If you are trying to visualize many large data tracks of sparse coverage, it is recommended to switch the figure to “Non-interactive” mode. This mode is turned on by default for “Large Figures”. We are always working to try to improve the editor performance. You can always help us out.
Interactive vs Non-Interactive Figures
Interactive
By default (except for “Large Figures”), figures are interactive. In interactive mode, PHAT uses a retained mode renderer based on SVGs to display figures and allow them to react to mouse movements and clicks. Memory consumption can rapidly become a problem when displaying hundreds of thousands of points of coverage across one or more coverage tracks.
Non-Interactive
In non-interactive mode, an immediate mode renderer based on canvas is used. This is far more performant in terms of both memory and CPU use for hundreds of thousands to millions of points of coverage and hundreds of contigs.
Key Differences
The quality of figure in each mode is slightly different. “Non-interactive” mode favours quantity over quality. The quality of coverage tracks may therefore be degraded in “Non-interactive” mode.
About Circular Visualization in PHAT
At its core, PHAT’s circular visualization is based on the Angular Plasmid library. Angular Plasmid provides a set of AngularJS templates that make it incredibly easy to construct circular figures such as PHAT creates. PHAT expands upon Angular Plasmid by providing a core set of templating functions to build figures. Individual components, such as data tracks, or the “base figure” (all contigs, reference and custom) itself have their templates preassembled and saved to disk.
For data tracks (whether the figure is interactive or not) as well as the base figure in non-interactive mode, PHAT uses an Angular Plasmid compatible directive compiler, ngPlasmid. ngPlasmid was tailor made to power PHAT’s genome builder. If you notice any performance issues or artifacts, consider filing an issue both on the PHAT repository as well as on ngPlasmid’s repository.
The majority of methods/classes involved in circular figure generation and manipulation are held here. Template generation methods in most cases are further wrapped by operations and never invoked directly in the renderer context of any window. These methods integrate with the project structure of PHAT to allow for persistence and lazy loading of pieces of figures. The genome builder takes this a step further by wrapping an in memory cache around the disk based methods of the circularFigure module to reduce trips to disk to fetch figure pieces.