For 0.11.0

Reports
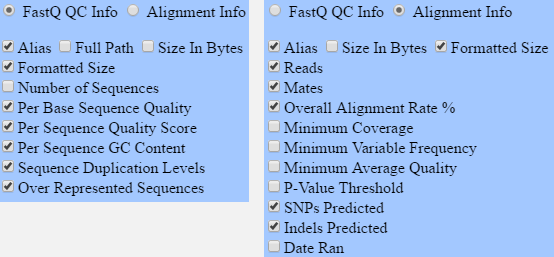
Reports on information about your read files and alignments are available in the output window. Click “OUTPUT” on the toolbar to open the window. This window presents a customizable table of information that can be exported to either Excel or comma-separated values (CSV) for further processing in other programs. Click on “OPTIONS” to toggle columns on and off and to change the report type. At any time, selecting either “Excel” or “CSV” in the options panel and clicking “EXPORT” will export the current table to the selected format. The rows which are visible in the report are controlled by selecting or unselecting inputs in the input window.
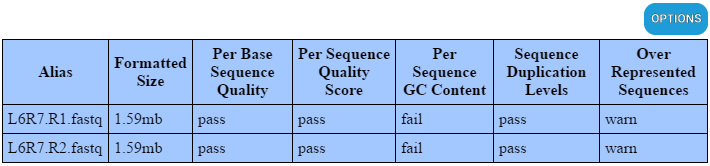
Quality Control Reports
By default, upon lauching the input window, QC reports for your read files are shown, with some default columns. More are available in the options panel.
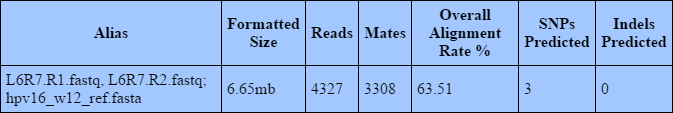
Alignment Reports
Clicking “OPTIONS”, and “Alignment Info” will change the report type to alignments. By default only a few columns are shown. Unlike the QC reports mentioned above, there are sub tables available to view and export within each alignment report.
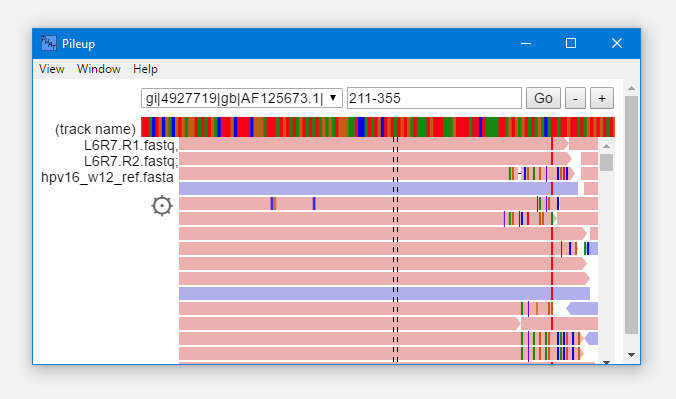
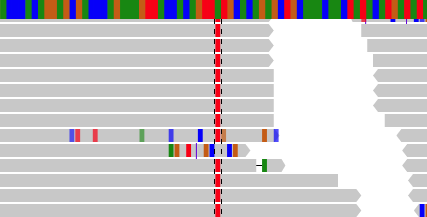
Visualizing Whole Alignment
Clicking on the “Alias” column for a given alignment will allow you to view the entire alignment in a graphical pileup view. We make use of Hammer Lab’s Pileup.js to view alignments. We are not using all of the features of Pileup.js, if there are other features you’d like to see us use to help you better understand your alignments, let us know.
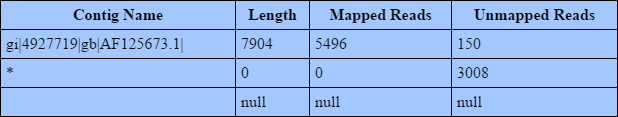
Mapped Reads Per Contig
Clicking on the “Overall Alignment Rate %” column for a given alignment will open a sub report breaking down total mapped and unmapped reads for each contig in the reference aligned against. This report is generated from the Samtools idxstats command.
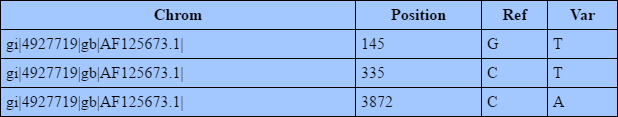
SNPs
Clicking on the “SNPs Predicted” column for a given alignment will open a sub report breaking down SNPs predicted by Varscan. By default, only a few columns are shown. Clicking on the “Position” column for a given SNP will open the pileup viewer for the alignment this SNP is from, at the position of the SNP, allowing you to visualize and verify SNP predictions. This report is generated by Varscan’s mpileup2snp command. See the documentation for more information about individual column meanings, as well as a list of options which you would like to see be customizable from within PHAT.
Indels
At the time of writing, PHAT uses Varscan to predict indels. However, we lack test data containing indels to allow us to build the feature. Help us make PHAT better.